Neighborhood Safety in New York City
While small crimes like robberies and break-ins aren't anything to discount, when many people think of neighborhood safety they think of violent crime. Below are maps outlining NYC neighborhood safety in terms of Murders on a per capita basis.
Keep in mind that boundaries (this is based on NYPD precinct) and population density can skew this data somewhat, but overall it provides a decent picture of which New York City neighborhoods are possibly the safest to live in and travel through.
The darker the color, the more dangerous the neighborhood (i.e. the most murders per capita). All data is for the period of January 1 to October 31st, 2014.
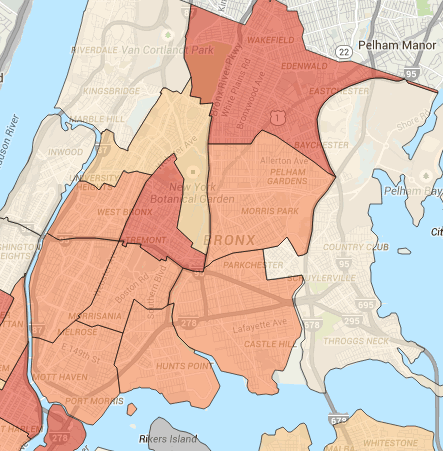
Murders per Capita in The Bronx, New York City
The outer edges of The Bronx are the safest.
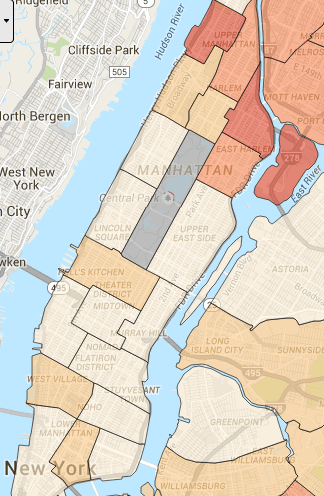
Murders per Capita in Manhattan, New York City
Parts of Harlem (northern tip of the island) are less safe than the rest of Manhattan.
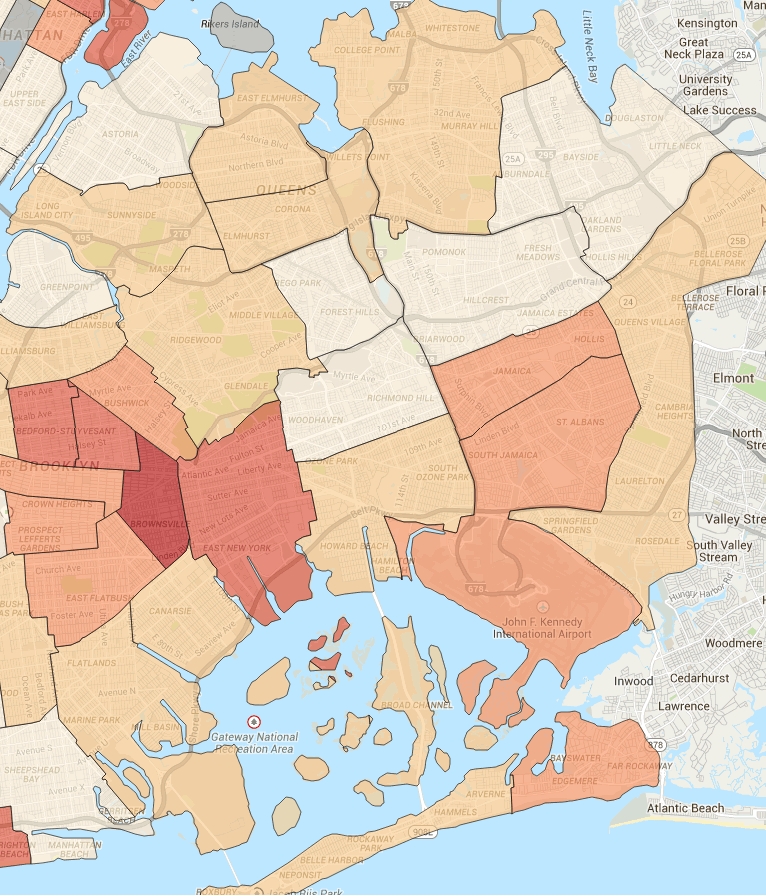
Murders per Capita in Queens, New York City
Jamaica and the edges of Brooklyn are less safe.
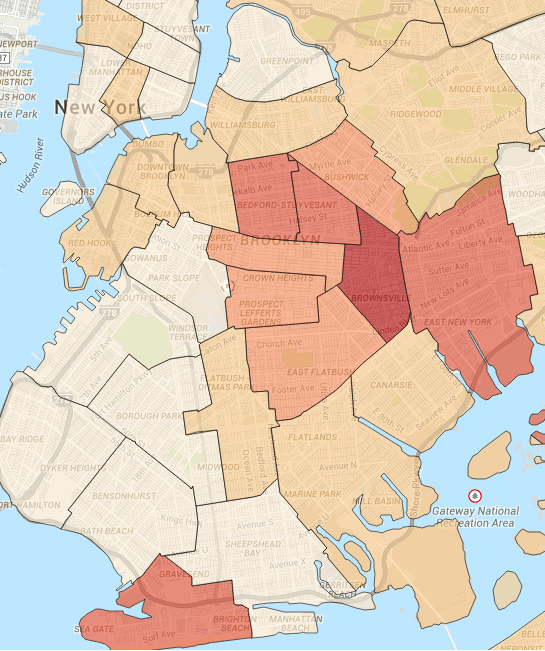
Murders per Capita in Brooklyn, New York City
Brownsville, East New York, Bedford-Stuyvesant and the southern tip are less safe.
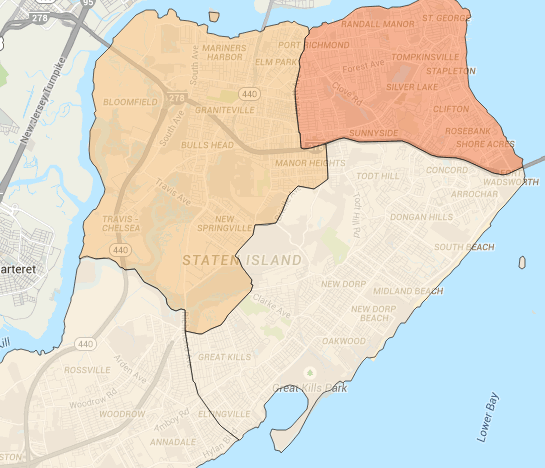
Murders per Capita in Staten Island New York City
The northern tip of Staten Island is the least safe.
To view a custom map for different date ranges and crime type - and zooming in for more detail - check out the NYC Crime Map put together by the NYPD.